上机作业 Iris_R
徐英泽 2024011267
返回引导页
0. 加载Iris数据集
library(datasets)
> data (iris)
> class (iris)			# 数据集类型
1. Iris数据集有几列?每列的数据类型是什么
[1] "data.frame"
> head (iris)			# 数据集前六行数据
Sepal.Length Sepal.Width Petal.Length Petal.Width Species
1          5.1         3.5          1.4         0.2  setosa
2          4.9         3.0          1.4         0.2  setosa
3          4.7         3.2          1.3         0.2  setosa
4          4.6         3.1          1.5         0.2  setosa
5          5.0         3.6          1.4         0.2  setosa
6          5.4         3.9          1.7         0.4  setosa
> ncol (iris)			# 数据集列数
[1] 5
> str (iris)
# 数据集结构,含每列数据的数据类型,分别为num,num,num,num和Factor。
'data.frame':	150 obs. of  5 variables:
 $ Sepal.Length: num  5.1 4.9 4.7 4.6 5 5.4 4.6 5 4.4 4.9 ...
 $ Sepal.Width : num  3.5 3 3.2 3.1 3.6 3.9 3.4 3.4 2.9 3.1 ...
 $ Petal.Length: num  1.4 1.4 1.3 1.5 1.4 1.7 1.4 1.5 1.4 1.5 ...
 $ Petal.Width : num  0.2 0.2 0.2 0.2 0.2 0.4 0.3 0.2 0.2 0.1 ...
 $ Species     : Factor w/ 3 levels "setosa","versicolor",..: 1 1 1 1 1
2. 按Species列将数据分成3组,分别计算Sepal.Length的均值和标准差,保存为一个csv文件,提供代码和csv文件的内容。
> mean_res <- aggregate(Sepal.Length ~ Species, iris, mean)
# 按Species列分组并计算平均值
> mean_res
Species Sepal.Length
1 setosa 5.006
2 versicolor 5.936
3 virginica 6.588
> sd_res <- aggregate(Sepal.Length ~ Species, iris, sd)
# 按Species列分组并计算标准差
> sd_res
Species Sepal.Length
1 setosa 0.3524897
2 versicolor 0.5161711
3 virginica 0.6358796
> res <- merge(mean_res, sd_res, by = "Species")
# 按Species项合并平均值与标准差结果
> res
Species Sepal.Length.x Sepal.Length.y
1 setosa 5.006 0.3524897
2 versicolor 5.936 0.5161711
3 virginica 6.588 0.6358796
> colnames(res) <- c("Species", "Mean.Sepal.Length", "Sd.Sepal.Length")
# 更改表头名字
> res
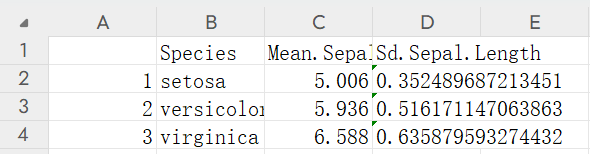
Species Mean.Sepal.Length Sd.Sepal.Length
1 setosa 5.006 0.3524897
2 versicolor 5.936 0.5161711
3 virginica 6.588 0.6358796
write.csv(res, "C:/Users/54727/Desktop/bioinformatic back up/bioinformatic/上机作业R/iris_summary.csv")
# 将结果输出为iris_summary.csv文件
iris_summary.csv文件截图如下
并且提供超链接 iris_summary.csv
3. 对不同Species的Sepal.Width进行One way ANOVA分析,提供代码和输出的结果。
> aov_result <- aov(Sepal.Width ~ Species, data = iris)
# Species为分组变量,Sepal.Width为响应变量
> summary(aov_result)
# 显示方差分析结果摘要表
             Df Sum Sq Mean Sq F value Pr(>F)
Species       2  11.35   5.672   49.16 <2e-16 ***		# 组间变异
Residuals   147  16.96   0.115                   		# 组内变异
---
Signif. codes:  0 ‘***’ 0.001 ‘**’ 0.01 ‘*’ 0.05 ‘.’ 0.1 ‘ ’ 1
P值<2e-16,具显著性,说明不同iris物种之间的萼片宽度具有显著性差异。